
Introduction
A well-structured CRM KPI dashboard transforms raw customer information into actionable strategic insights. While modern systems are a goldmine of data, many organizations struggle with disconnected reports and manual spreadsheet compilation, making it difficult to demonstrate the true ROI of their CRM investment.
Streamline your software evaluation process
To turn fragmented metrics into a strategic asset, businesses must implement centralized CRM KPI dashboards. This article serves as a comprehensive create CRM dashboard business tutorial, providing a step-by-step framework for CRM users and buyers. You will learn how to define core metrics, integrate data sources, and design an actionable dashboard that drives growth, operational efficiency, and data-driven decision-making.
Key Takeaways
Raw CRM data overwhelms teams without clear KPI focus.
Define 5–9 SMART KPIs to turn data into actionable insight.
Align dashboards with business outcomes, not vanity metrics.
Use CRM‑native tools for faster setup and cleaner integration.
Involve end‑users early to ensure dashboard adoption and relevance.
Software covered in this article
For learning and reference, this listicle presents a selective overview of best crms for small business:






Why a KPI-Driven Dashboard is Essential for CRM Users & Buyers
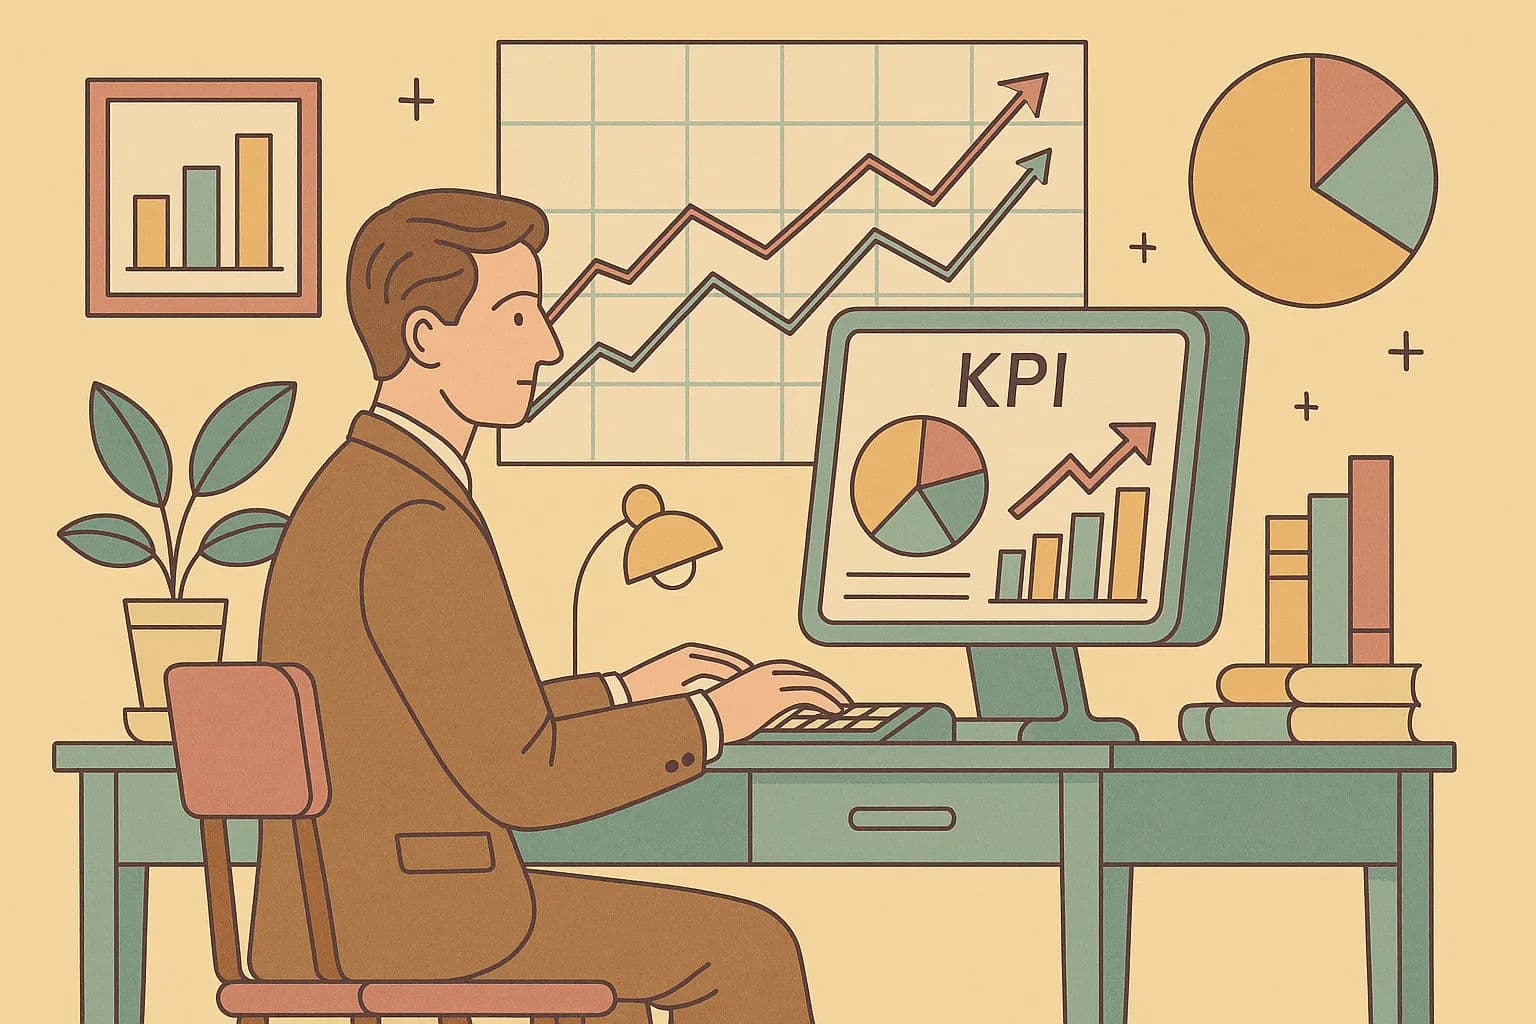
Feeling overwhelmed by endless data streams and struggling to connect daily activities to overarching business goals? You're not alone. A well-designed KPI dashboard is the antidote to data paralysis. It serves as a command center, providing a real-time, visual representation of your business's health and performance.
*👉 Struggling to connect the data dots? Discover better software matches with *AuthenCIO’s AI!
1. Bridging the Gap: From Raw Data to Actionable Insights
A KPI dashboard translates complex datasets from your CRM and other integrated systems into clear, digestible insights. Instead of manually compiling spreadsheets—a process prone to human error—you get an automated, at-a-glance view of what's working and what isn't. Research shows that organizations that align KPIs with strategic objectives achieve higher efficiency, and real-time KPI tracking enables significantly faster decision-making compared to traditional, retrospective reporting.
2. Key Benefits: Enhanced Visibility, Accountability, and Strategic Decision-Making
Implementing a KPI-driven dashboard delivers tangible benefits across your organization:
Enhanced Visibility & Collaboration: Gain a holistic view of performance across sales, marketing, and customer service. By creating a single source of truth, you break down departmental silos and align cross-functional teams around shared goals.
Increased Accountability: When KPIs are visible to everyone, teams understand their direct impact on business objectives, fostering a culture of ownership and performance.
Proactive Strategy & Risk Mitigation: Move from reactive problem-solving to proactive strategy. Spot negative trends early, anticipate challenges before they become critical, and allocate resources with confidence, knowing your decisions are backed by data.
Clear ROI for CRM Buyers: For those evaluating or justifying a CRM investment, a dashboard provides the ultimate proof of value. It visualizes the impact of the CRM on key metrics like sales growth, customer retention, and operational efficiency, making it easy to calculate and present a clear return on investment to leadership.
Phase 1: Defining Your Key Performance Indicators (KPIs)
Understanding how to set KPIs for CRM performance dictates your dashboard's effectiveness. Avoid vanity metrics that ignore actual business outcomes (e.g., social media likes). Instead, select KPIs for CRM that are directly tied to your strategic objectives.
You must also track CRM adoption KPIs, such as daily active users and record completeness. Without high user adoption, your performance data is incomplete and unreliable, making these baseline metrics essential.
Identifying Core Business Objectives for CRM
Before you select a single metric, ask the fundamental question: What are we trying to achieve with our CRM? Your objectives might include:
Increasing annual recurring revenue (ARR) by 20%.
Reducing customer churn by 15%.
Improving the sales cycle velocity.
Increasing the marketing-to-sales lead conversion rate.
These high-level goals will serve as your North Star, guiding the selection of relevant KPIs.
Prioritizing the Vital Few: Leading vs. Lagging Indicators
You can't track everything. To avoid information overload, focus on the 5-9 most critical KPIs per dashboard. A balanced view includes both:
Lagging Indicators: These measure past performance and tell you if you’ve achieved your goals (e.g.,
Quarterly Sales Revenue). They are easy to measure but hard to influence directly.Leading Indicators: These are predictive and measure the activities that drive future results (e.g.,
Number of Sales Demos Booked). Focusing on these allows you to influence outcomes before they happen.
Selecting Relevant KPIs: Sales, Marketing, Customer Service & Beyond
With your objectives defined, you can now choose KPIs that measure progress. As a key trend, organizations are increasingly aligning marketing and sales KPIs to optimize the entire customer journey.
Beyond standard metrics, teams now track financial health. For instance, using Crelate CRM customizable dashboards, profitability KPIs become highly visible. When you setup a net operating revenue dashboard in a CRM or setup an operating income dashboard in a CRM, you directly connect closed-won sales data with operational costs to ensure sustainable growth.
Area | KPI | What It Measures/Why It Matters |
|---|---|---|
Sales | Lead Conversion Rate | Effectiveness of lead qualification; predicts revenue |
Sales | Sales Cycle Length | Average time to close a deal |
Sales | Average Deal Size | Value of wins for revenue forecasting |
Customer Service | Average Resolution Time | Time needed to resolve customer issues |
Customer Service | CSAT Score | Direct measure of customer happiness |
Customer Service | Customer Churn Rate | % of customers lost over a period |
Marketing/Operations | Total cost to acquire a new customer | |
Marketing/Operations | Customer Lifetime Value (CLTV) | Predicted total revenue per customer |
Marketing/Operations | CRM User Adoption Rate | % of team actively using CRM (ROI impact) |
SMART KPI Framework: Ensuring Measurability and Achievability
To ensure your KPIs are effective, vet them against the SMART criteria:
Specific: Is the objective clear and unambiguous?
Measurable: Can you quantify the KPI?
Achievable: Is the goal realistic given your resources?
Relevant: Does this KPI directly impact a core business objective?
Time-bound: Is there a defined timeframe for achieving the goal?
Phase 2: Data Collection Strategy
A dashboard is only as reliable as the data that feeds it. This phase focuses on identifying your data sources and ensuring the information is accurate, consistent, and timely.
Identifying Data Sources: CRM, ERP, Marketing Automation
Your CRM is the primary data source, but it's rarely the only one. A comprehensive view requires pulling data from multiple systems:
CRM: Customer data, sales pipeline, and service interactions.
ERP (Enterprise Resource Planning): Financial data, inventory, and supply chain information.
Marketing Automation: Campaign performance, email engagement, and web analytics.
Financial Software: Revenue, profit margins, and cash flow.
Ensuring Data Quality and Governance
Poor data quality will undermine your entire effort. Establish clear data governance policies:
Standardize data entry: Use dropdowns, validation rules, and required fields in your CRM to minimize errors.
Implement regular data hygiene routines: Schedule time to de-duplicate contacts, merge records, and purge outdated information.
Establish clear ownership: Assign responsibility for maintaining data accuracy within each source system.
Phase 3: Data Integration Strategy
To understand how to connect CRM data with business dashboards, you must consolidate disparate systems using native integration connectors, third-party middleware, or custom APIs. This secure pipeline is critical for creating a single source of truth and achieving a 360-degree view.
Overcoming Common Integration Challenges
Data Silos: Information is trapped in different platforms that don't communicate.
Inconsistent Formats: Dates, names, and currencies may be formatted differently across systems, requiring complex data mapping.
Cost & Complexity: Custom integrations can be expensive and require specialized IT resources, while ongoing API maintenance creates a hidden burden.
Security & Compliance: Centralizing data requires strict access controls and adherence to regulations like GDPR and CCPA to protect sensitive information.
Choosing Your Integration Method
Native Integrations: Many CRMs like Freshdesk and Zoho have built-in connectors for popular apps. These are the easiest to set up.
iPaaS (Integration Platform as a Service): Tools like Zapier or Workato offer user-friendly, no-code/low-code connectors for thousands of applications. They are excellent for businesses without dedicated IT teams.
Direct API/ETL: For complex, high-volume needs, a custom solution using APIs (Application Programming Interfaces) or ETL (Extract, Transform, Load) tools like Stitch or Fivetran may be necessary, often requiring developer support.
👉 Too many tools to connect? Compare software that’s built for seamless integration
Phase 4: Choosing the Right Dashboarding Tool
With KPIs defined and data mapped, buyers must evaluate whether to use native CRM tools or a specialized Business Intelligence (BI) platform.
To evaluate the right tools, apply these core CRM dashboard selection criteria:
Integration: Native connectivity to your CRM, ERP, and marketing systems.
Customization: Role-based views and flexible, drag-and-drop widgets.
Real-Time Data: Ability to refresh data without performance lag.
Usability: Intuitive interfaces for non-technical users to build reports.
Scalability & Cost: Transparent pricing that supports growing data volumes and user counts.
Native CRM Dashboards vs. Dedicated BI Platforms
Native Dashboards: Convenient, cost-effective (often included with your CRM), and easy to set up for core CRM metrics. They are perfect for departmental teams needing a quick view of their direct performance.
Dedicated BI Platforms: Offer superior customization, advanced visualization options, and the ability to connect to virtually any data source. They are ideal for creating executive-level dashboards that consolidate data from across the entire organization.
CRM-Specific Solutions (e.g., Zoho Analytics, Salesforce Reports & Dashboards)
Platforms like Zoho Analytics and Salesforce Reports & Dashboards offer a powerful middle ground. They are deeply integrated with their parent CRM but also provide advanced analytical capabilities.
General Business Intelligence Tools (e.g., SAP Analytics Cloud, Power BI)
For enterprise-level needs, tools like SAP Analytics Cloud or Microsoft Power BI are the industry standard. They excel at handling massive datasets and offer predictive analytics features, leveraging AI to forecast future trends.
Key Features and Considerations for Buyers
Total Cost of Ownership: Look beyond the license fee. Factor in costs for implementation, integration, training, and ongoing maintenance.
Learning Curve: Powerful BI tools require more training and can be intimidating for non-technical users. Consider the resources you have for user enablement.
Scalability & Portability: Can the tool easily accommodate more users, data sources, and complexity as your business grows? If you invest in a native dashboard, consider the implications if you ever switch CRMs.
Real-time Updates & Mobile Access: Ensure the tool can refresh data at your desired frequency and is accessible on the go.
Discover software that meets your unique requirements
Phase 5: Designing Your KPI Dashboard for Clarity and Impact
To customize a CRM dashboard to track key performance indicators for your sales pipeline, prioritize clarity. Select pipeline-centric widgets like funnel charts for stage conversions. Apply filters for timeframes and reps. Track time spent in deal stages to highlight bottlenecks. Use color-coded thresholds to show if revenue meets targets, and position high-level metrics (total open pipeline) at the top for at-a-glance visibility.
Dashboard Layout Best Practices: The 'At-a-Glance' Principle
Structure your dashboard logically. Place the most critical, high-level KPIs at the top left, as this is where a user's eye naturally goes first. Use a grid-based layout to keep the design clean and organized. Group related metrics together to create thematic sections (e.g., a 'Sales Pipeline Health' section).
Visualizing Data Effectively: Charts, Graphs, and Gauges
Data visualization is about choosing the right medium for your message. Don't just default to a pie chart for everything.
Choosing the Right Visualization for Each KPI
Line charts: Ideal for tracking a metric over time (e.g., monthly recurring revenue).
Bar charts: Best for comparing values across categories (e.g., sales performance by rep).
Gauges or single number cards: Perfect for displaying a single, critical KPI against a target (e.g., quota attainment).
Tables: Use for detailed, granular data that needs to be looked up, but use them sparingly to avoid clutter.
Avoiding Information Overload: Focus on Key Metrics
A dashboard is not a data dump. Resist the temptation to include every metric possible. A cluttered dashboard is an ignored dashboard. Focus on the 5-9 most critical KPIs that align directly with your strategic goals. Use visual cues like color (e.g., green for on-target, red for below-target) to draw attention to what matters most. For accessibility, use colorblind-friendly palettes and ensure high contrast.
Customization and Personalization for Different User Roles
Your CEO, sales manager, and customer service rep need different information. Effective tools create role-based views with interactive filters. For example, using Crelate CRM customizable reporting dashboards, team-specific KPIs are easily monitored by department heads. Meanwhile, through Crelate CRM customizable dashboards, executive team performance KPIs provide leadership with high-level company summaries. This role-based approach ensures a sales manager can drill down into their team's pipeline and activity metrics without cluttering the CEO's view.
Phase 6: Implementation, Monitoring, and Iteration
Building a dashboard is not a one-time project. It's a dynamic tool that must evolve with your business. The final phase is about launching, driving adoption, and continuously refining your dashboard.
Setting Up Alerts and Notifications for Critical Thresholds
Configure automated alerts to notify stakeholders when metrics cross critical limits—like an email for 20+ open tickets, or a Slack ping when a major deal is won.
Also, establish visual markers. To set a KPI threshold in Zoho Analytics, open the KPI widget settings and define target values to color-code results. To visualize a threshold on a pie chart in Zoho Analytics, apply conditional formatting to dynamically change a slice's color when it breaches your limit.
Driving Adoption and Managing Change
Involve End-Users: Include team members in the design and testing process. A dashboard built for them should be built with them to ensure it's relevant and useful, fostering a sense of ownership.
Provide Training: Host sessions to show your team how to read, interpret, and use the dashboard to inform their daily work. Highlight quick wins and individual benefits to overcome resistance to change.
Document Everything: Create a simple guide or data dictionary explaining what each KPI means, its data source, and how often it refreshes. For larger organizations, implement version control to manage changes effectively.
Regular Review and Optimization of Your Dashboard
Schedule regular check-ins (e.g., quarterly) to review the dashboard's effectiveness. Ask key questions: Are these still the right KPIs? Is the information leading to action? Is there any metric that no one looks at? Use this feedback to prune irrelevant metrics and add new ones as your business priorities shift.
Real-World Examples of KPI-Driven Dashboards in Action
Let's visualize how these principles apply to specific business functions.
1. Sales Performance Dashboard
A sales manager's dashboard functions as a critical CRM KPI scorecard to evaluate team performance and pipeline health. This scorecard features a clear sales funnel visualization. Key metrics like 'New Leads,' 'Deals in Pipeline,' and 'Closed Won Revenue' are displayed as single-number cards. A bar chart compares each sales rep against their quota, while a line chart tracks sales velocity over the past six months.
2. Customer Service Health Dashboard
A support lead's dashboard would focus on operational efficiency and customer satisfaction. Gauges would show real-time CSAT scores and First Response Time. A stacked bar chart could break down ticket volume by channel (email, phone, chat), and a table would list any tickets that have breached their SLA (Service Level Agreement).
Try AuthenCIO
Move to faster, smarter software evaluation with AI
3. Executive Summary Dashboard
A CEO or buyer needs a high-level, cross-functional view. This dashboard would pull summary data from sales, marketing, and service. It might feature top-line KPIs like Total Revenue, Customer Lifetime Value (CLTV), Customer Acquisition Cost (CAC), and Net Promoter Score (NPS), allowing for a quick health check of the entire business and its CRM's contribution to it.
Conclusion: Empowering Your CRM Strategy with KPI-Driven Insights
Building a KPI-driven dashboard is a transformative step for any organization using a CRM. It moves you from simply collecting data to actively using it as a strategic asset. By carefully defining your objectives, selecting meaningful KPIs, choosing the right tools, and designing for clarity, you create a powerful command center that enhances visibility, drives accountability, and empowers intelligent, data-backed decisions.
The process is iterative, but as this performance dashboard guide has shown, the payoff is immense: a more agile, efficient, and competitive organization poised for sustainable growth. You now have the framework to start your journey from data paralysis to data-driven success.